
Pillar pages are comprehensive, authoritative pages that link related content clusters and provide an in-depth overview of a broad topic. They drive SEO impact and guide users through your content ecosystem. But how do you know if your pillar page is actually doing its job? That’s where pillar page metrics come into play.
From tracking organic traffic and engagement to monitoring keyword rankings and internal link performance, the right metrics give you insight into what’s working—and what needs refining. In this blog, we’ll break down the key performance indicators every marketer should track to ensure their pillar pages are pulling their weight and delivering serious ROI.
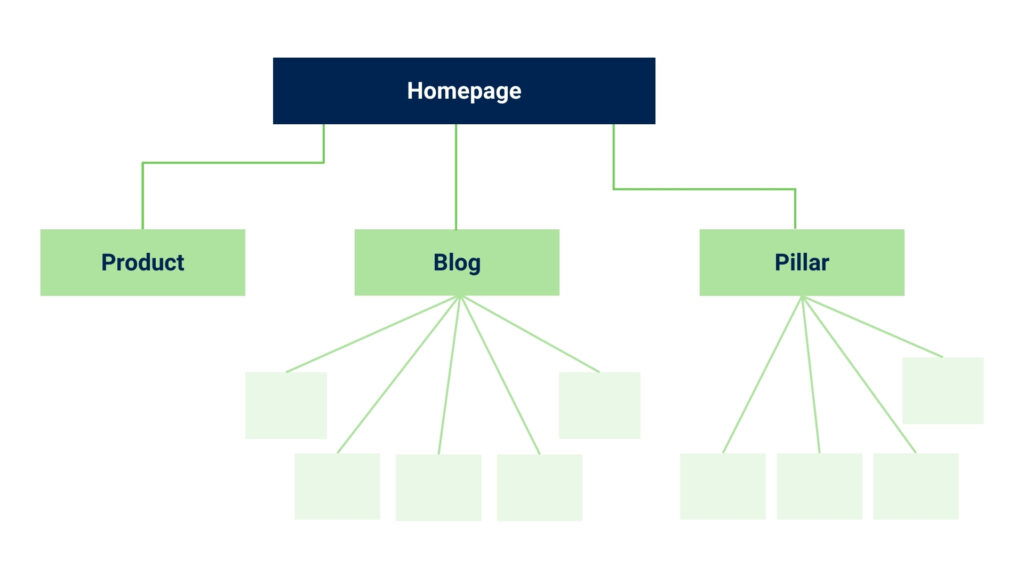
Example website architecture with pillar pages
- Search appearance (Google Search Console): Number and position of primary and secondary keywords for which the pillar page ranks.
Organic traffic (new users): Measures how many new visitors discover your page via search.
Branded vs. non-branded keyword traffic: Indicates whether users find your page through general topics or your brand name.
- Organic traffic: Number of visitors organic search results.
Direct traffic increases: Suggests strong brand recall and returning users.
- Overall traffic: Visitors from all sources, including direct, referral, social, and paid traffic.
Backlinks and referring domains: Reflects how many external sites are linking to your page, boosting brand credibility.
- Social shares or engagement: Number of times your pillar page is shared on social media platforms or is commented on.
Time on page: Shows how long users are engaging with your content.
Newsletter signups or lead magnet downloads: Tracks how many visitors opt in to stay connected with your brand.
Metrics to measure engagement
- Average time on page: How long visitors stay on your pillar page. A longer average time suggests users find the content valuable.
- Scroll depth: How far down the page users scroll to identify if users are engaging with the entire content or dropping off at specific points.
- Bounce rate: Percentage of visitors who leave your site after viewing the pillar page without interacting further. A high bounce rate may indicate that the content is not meeting users’ expectations.
- Pages per session: Number of pages a visitor views during their session. Higher pages per session indicate users are exploring more of your content, which will likely increase the conversion rate.
- Internal link clicks: Tracks how often users click on links to related subtopics or cluster pages.
Exit rate: Tells you how often the pillar page is the last page viewed—a lower exit rate can indicate deeper engagement.
Video views or interactions (if embedded): Tracks whether users engage with multimedia content on the page.
Comments or on-page interactions (if enabled): Shows user participation and feedback.
Form fills or CTA clicks (non-conversion): Indicates user interest even if they don’t fully convert.
- Social shares or engagement: Number of times your pillar page is shared on social media platforms or is commented on.
Pillar page metrics for revenue
- Conversion or click-through rate: Percentage of visitors who complete a desired action, such as filling out a form, subscribing to a newsletter, or making a purchase after visiting your pillar page.
- Leads: Number of contact form submissions, or other lead capture mechanisms.
Lead quality or sales-qualified leads (SQLs): Measures if the pillar page is attracting high-intent, sales-ready leads.
Let’s build pillar pages
Are you looking to improve your website’s performance by organizing the content and building pillar pages? Let us audit your website and provide strategies to increase engagement and conversion.